I’ve blogged before about how some things are different in the cloud, namely Azure. That post dealt with finding out why your Azure Role crashed by using some of the logging facilities and storage available in Azure. That’s kind of a worst case scenario, though. Often, you’ll just want to gauge the health of your application. In the non-cloud world, you’d just use the Windows Performance Monitor to capture performance counters that tell you things like your CPU utilization, memory usage, request execution time, etc. All of these counters are great to determine your overall application and server health as well as helping you troubleshoot problems that may have arisen with your application.
I’m often surprised at how many developers have never used Perfmon before or think that it is purely a task that administrators need to care about. Performance is everyone’s responsibility and a tool like Perfmon is invaluable if you need to gain an accurate understanding of your application’s performance.
When you’ve needed to log counters in the past, you would have probably become familiar with this dialog:

In the Azure world, you can add counters to be collected in a variety of ways. A popular way is just to add the counters you want in your OnStart() event.
public override bool OnStart()
{
    DiagnosticMonitorConfiguration dmc = DiagnosticMonitor.GetDefaultInitialConfiguration();

    // Add counter(s) to collect.
    dmc.PerformanceCounters.DataSources.Add(
        new PerformanceCounterConfiguration()
            {
                CounterSpecifier = @"\Processor(*)\*",
                SampleRate = TimeSpan.FromSeconds(5)
            });

    // Set transfer period and filter.
    dmc.PerformanceCounters.ScheduledTransferPeriod = TimeSpan.FromMinutes(5);

    // Start logging, using the connection string in your config file.
    DiagnosticMonitor.Start("DiagnosticsConnectionString", dmc);

    ...

    return base.OnStart();
}
This gets the job done quite nicely and even though we’re sampling our performance counter every 5 seconds, the data won’t get written to our persistent storage until we hit the 5 minute mark.
So, let’s fast forward a bit. You’ve added counters to monitor and now you want to view some of this data. Fortunately, there are a few tools at your disposal:
For example, using the Azure Management Tool, you can navigate to the Diagnostics/Analysis section to view the performance monitor counters you stored.

Herein lies one of the challenges you may encounter. Azure is kind of a different beast and it doesn’t store the data in storage using the typical BLG format. Instead, if you look at the raw data, it will be in an XML or tabular format and may look like:

While this is nice and clean, the problem you’ll hit is the visualization of the data. Most organizations use Perfmon to visualize the counter data you record. Alas, in this case you can’t use it that way right out of the box. Fortunately, my friend Tom Fuller and I realized this gap and he wrote a plug-in to the Azure Management Tool that will transform this data from the format above into a native BLG format. He wrote up a great blog entry with step-by-step instructions and the source code here. You can also download a compiled version of the extension here (along with the Windows Azure MMC) here. To install the plugin, just copy the DLL into the \WindowsAzureMMC\release folder:

Then, when you open up the tool, you’ll see another option in that dropdown in the Diagnostics > Analysis window:

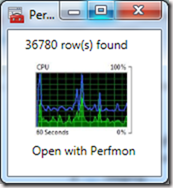
Then, when you click show, you’ll get a nice popup telling you to click here to view your data in Perfmon:

Then, when you click on it, Perfmon will start with all of the counters added to the display:

A few things to note:
- It will store the resulting BLG file at the following path:
c:\Users\<user name>\AppData\Local\Temp\<File Name>.blg
The BLG can be used in a variety of applications. For example, you can use it with the great PAL tool.
- All of the counters will appear in the graph by default. Depending upon the amount of data you’re capturing, this could give you data overload. Just something to be aware of.
Until next time.